The Trail Behind a Quoted Statistic
Trace a quoted statistic to its original source, identify what it measures and see what the citation leaves unproven before you repeat the number.
The most common mistake with a quoted statistic is to treat the citation beside it as if it settles what the number means. That can turn a narrow count into a broad claim: a report says a figure rose, and readers come away thinking it proves a whole policy worked. To trace a quoted statistic, follow the number back through each source, then inspect the original material for its measure, scope and limits.
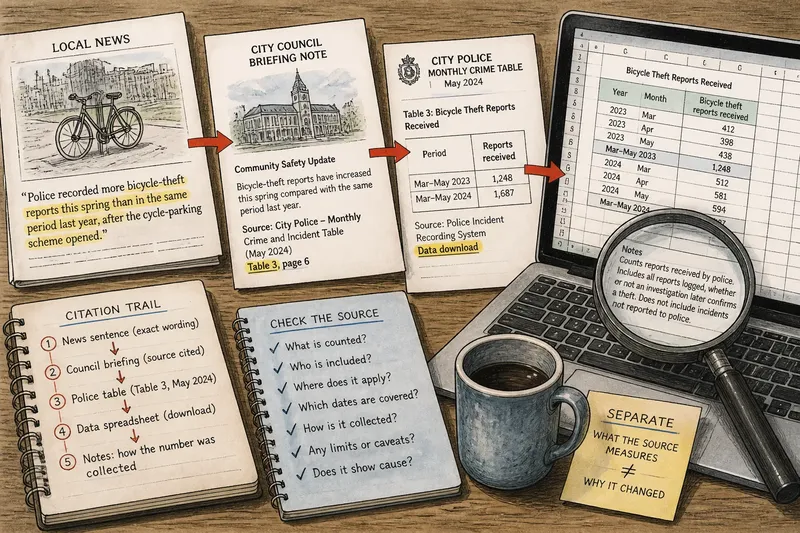
Imagine a fictional local news report saying that reports of bicycle theft rose in the city after a new cycle-parking scheme began. The article attributes the figure to a council briefing, which in turn cites a monthly table from the city police. The number sounds straightforward, but the trail raises several questions: what counts as a report, which area and period are included, and does a rise in reports establish a rise in thefts?
Start with the exact sentence that carries the number
Copy the sentence, including any words immediately around the figure. Qualifiers such as “reported”, “recorded”, “estimated” or “up to” often do as much work as the number itself. Also note what the sentence says caused the change, if it names a cause.
In the invented report, suppose the sentence reads: “Police recorded more bicycle-theft reports this spring than in the same period last year, after the cycle-parking scheme opened.” This wording makes a comparison and places two events in sequence. It does not, by itself, say the scheme caused the increase. Keeping the original phrasing visible helps prevent a later paraphrase from quietly strengthening the claim.
Record the citation exactly as printed: the named organisation, document title, link, publication date if supplied, and any table or page reference. If the article links only to a council briefing, begin there rather than searching for a loosely similar figure. A citation is a trailhead, not a stamp of approval.
Follow each link until you reach the number’s source
The first source may be a press release, briefing note or another news article rather than the material that produced the figure. Open each link and look for its own references, footnotes, data downloads or named source. Follow those references until you reach the organisation or document that compiled the underlying records.
In this fictional case, the council briefing points to a police table, and the table links to a downloadable spreadsheet. That spreadsheet is the closest available source for the count. The police are the source of the recorded reports; the council briefing and news report are later tellers of the figure. Those roles matter because each layer may select, summarise or explain the number differently.
If a link is broken, search the exact document title in quotation marks alongside the organisation’s name. A site search or the organisation’s document archive may surface a replacement. If the original remains unavailable, say so in your own notes and avoid presenting a second-hand figure as though you inspected the underlying material.
Keep a simple trail as you go:
- News sentence and its exact wording.
- News report’s cited document or organisation.
- References named in that document.
- Original table, dataset or report, if accessible.
- Any explanation of how the number was collected.
Think of the citation trail like a parcel’s forwarding labels: each label tells you where it travelled, but not whether the contents changed. Compare the number and wording at each stop. A source may round a figure, use a different time span or describe a count as an estimate.
Check what the original number actually measures
Once at the source, find the table title, column headings, notes and definitions. Ask what event is counted, who or what is included, where the records come from, and which dates the figure covers. A number without its unit is like a map without a scale: it may look precise while leaving its reach unclear.
In the fictional spreadsheet, the column is labelled “bicycle theft reports received”, not “confirmed bicycle thefts”. A note explains that the count includes reports logged by police, whether or not an investigation later confirms a theft. The source therefore measures reports received. It does not directly count every theft that occurred, and it cannot reveal incidents nobody reported.
Next, check the comparison. Does “this spring” mean the same dates in both years? Are the figures for the same city boundary and reporting system? Did the source revise past entries or change its categories? Even a consistent count can be misleading if the periods or definitions do not match.
For the invented report, suppose both columns cover the same seasonal months and the same police area. That makes the comparison more coherent, but it does not settle whether reporting habits changed. The result is still a difference in logged reports, not a complete census of bicycle theft.
Look for the denominator when the report uses a rate or says something became more common. A raw count and a rate answer different questions: the count gives the number of recorded events, while a rate relates events to a population or other base. If the source supplies only a count, do not silently turn it into a per-person or per-bike claim.
Separate the measured change from the explanation
The source can establish what its records contain and how the figure compares under its stated method. A separate claim may explain why the number changed. That explanation needs evidence of its own; the fact that one event followed another is not enough to assign cause.
In the fictional case, the cycle-parking scheme opened before the reported increase. The spreadsheet contains no analysis of the scheme, and it does not compare areas with and without new parking. It therefore cannot show whether the scheme led to more thefts, encouraged more people to report them, or had no bearing on the count.
There may be plausible explanations in several directions. More people could have started cycling, making more bikes available to steal; a public campaign could have made reporting easier; police systems could have changed; or thefts could genuinely have become more frequent. Plausibility is a reason to ask what evidence exists, not a licence to pick the explanation that fits the headline.
Check whether the source itself offers context, such as a method note, a comparison with other areas or a warning about incomplete records. Then distinguish that context from your own inference. If the material does not address causation, the careful wording is that recorded reports rose during the period, not that the scheme caused the rise.
What can this citation establish?
What if the article links to a press release?
Use the release to identify the organisation’s stated figure and any underlying document it names. Then follow that reference to the table or report, because a release may select only the figures that support its message. If no underlying material is offered, treat the number as attributed rather than independently traceable.
What if the original table has no method note?
State only what its labels and visible structure support, and mark the missing definition as a limit. Look for a data dictionary or general collection guidance from the same source, but do not assume it applies to that table unless the connection is clear. An absent method note leaves uncertainty; it does not make the number meaningless.
Does a larger count prove that risk increased?
No. A count may rise because the population or exposure grew, because reporting improved, or because the underlying event became more common. To make a claim about risk, you need a suitable denominator and evidence that the records and comparison are fit for that question.
Can a citation prove the stated cause?
Only if the cited material actually examines that causal claim and its design supports the conclusion. A table that records events over time can show a pattern in those records, but timing alone does not identify what produced it. Check whether the article cites a separate analysis for the explanation.
Carry forward the number with its limits intact
Before repeating a figure, write a plain sentence that preserves its measure and scope. For the invented situation, a careful version would be: “The police table records more bicycle-theft reports in the stated spring period than in the matching period a year earlier; it does not establish how many thefts occurred or whether the parking scheme caused the change.” The sentence is less dramatic than a claim about a surge in theft, but it tells readers what the source can support.
If the figure matters to a decision, keep a note of the source link, table label, date range and any method caveat. That small record makes it easier to revisit the claim if the source updates its material or a later report uses a different definition. It also prevents a number detached from its context from acquiring fresh certainty each time it is repeated.
A quoted statistic is not a single object passed intact from source to reader; it is a claim carried through documents, summaries and wording choices. Follow the trail until you can name what was counted, and let that definition travel with the number. When the citation cannot answer a question, keeping that gap visible is part of accurate reporting.